
tcpTunnel Scan
Resection - TSCAN1
5.4 Resection
The orientation is calculated in this option by observing two or more control points having known coordinates.
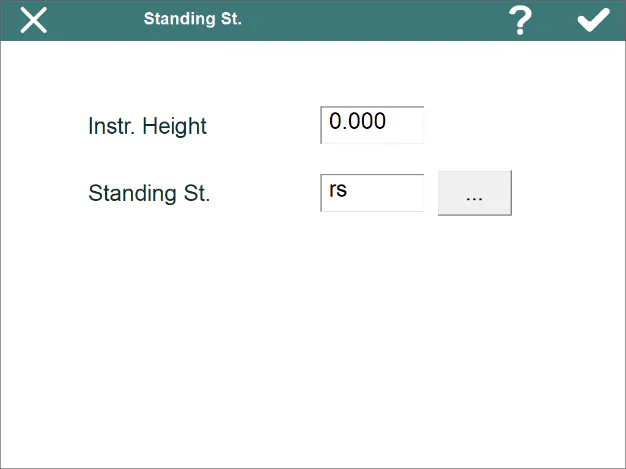
First, the name for the new standing station to be calculated and the instrument height are requested.
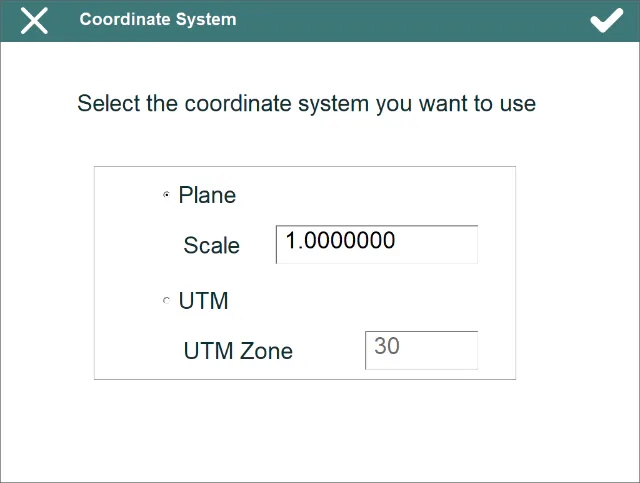
Then one has to indicate whether one wishes to work with Plane or UTM coordinates. In the latter case, the UTM Zone should be indicated.
.
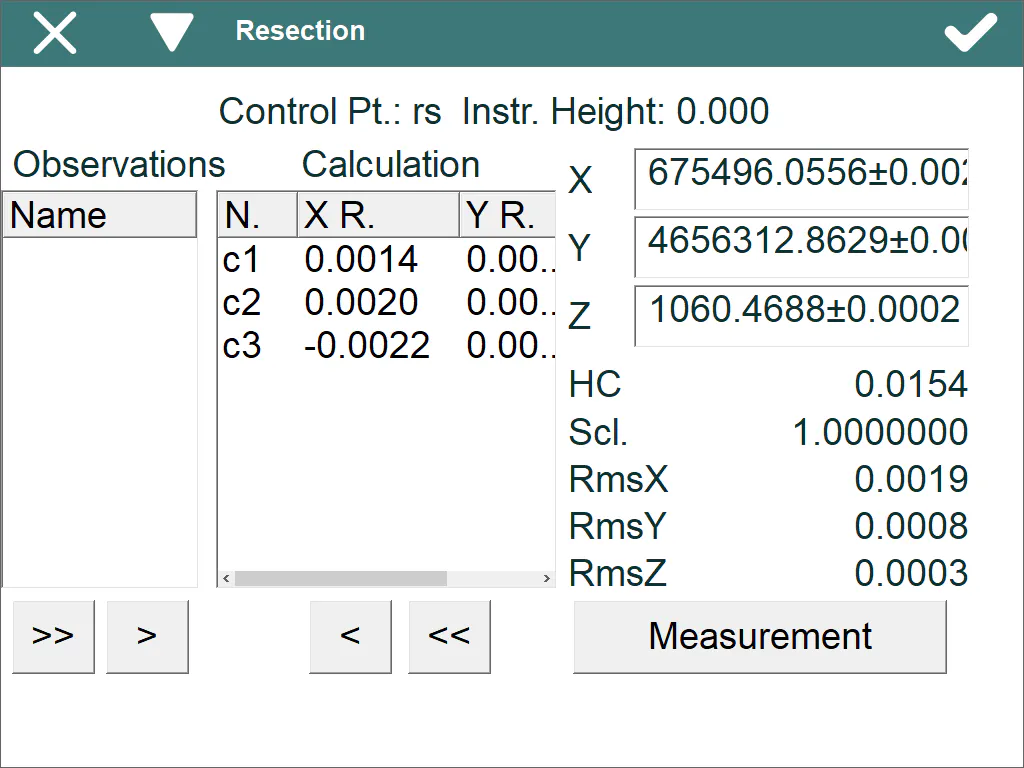
By last, a window appears where the standing station's coordinates are calculated. This calculation is made automatically while observations are added to the Calculation list using the  and
 buttons. Should you wish to remove any specific observation, you will have to select it in the Calculation list and click on
 . The
 button deletes all of them at the same time.
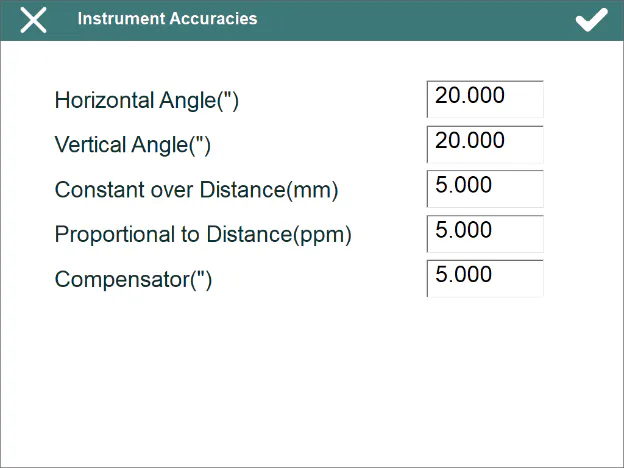
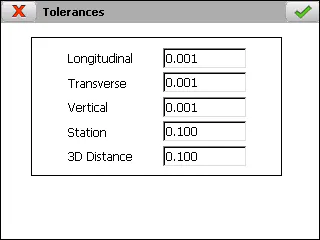
The user must enter the accuracy parameters of the total station before make the calculation. This option is available within the menu of the title bar, y allows one to set up the values for calculating the uncertainties of the angle and distance measurements.
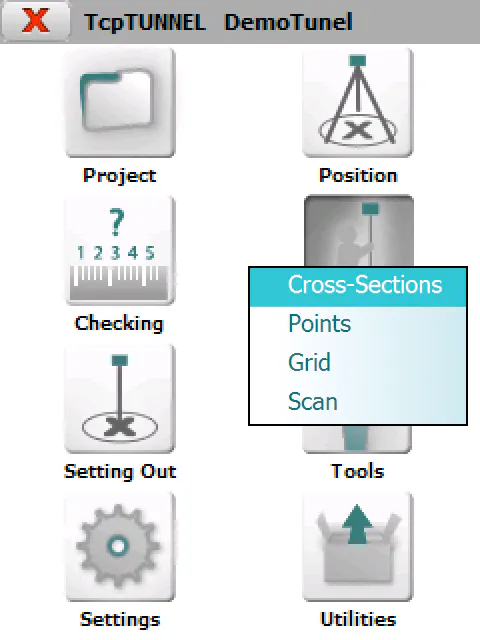
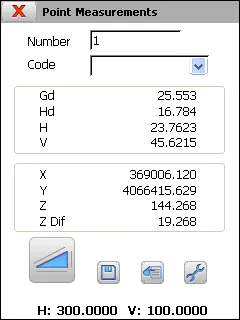
In order to add a new Measurement, the button carrying the same name should be clicked. In the screen that appears, one should enter the name of the control point that will be measured and do the measurement. This one can be done with reverse measurement checking the toggle within Settings option in the menu of the title bar.
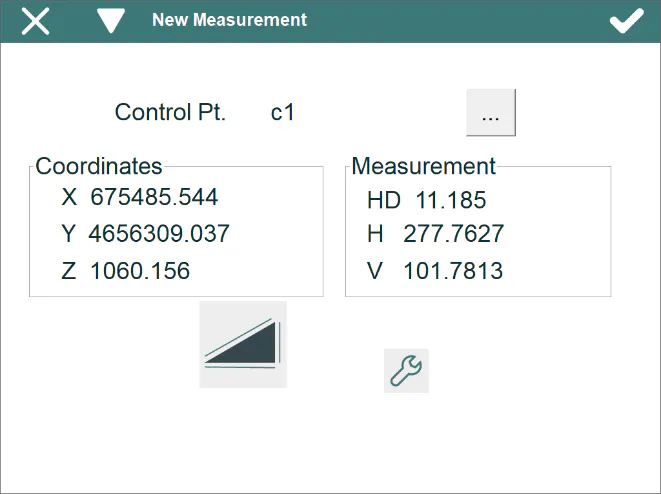
Also, with motorized total stations, the program allows to rotate automatically the total station for doing the reverse measurement and for looking for the selected control point after 2 or more control points have been measuring.
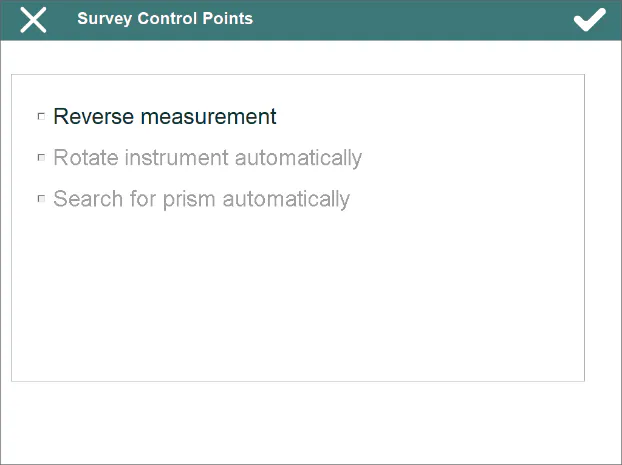
After doing a control point measurement, this one is added to Calculation list. The parameters will be calculated automatically if 2 or more control points have been measured.
The program shows the X, Y and Z coordinates, Scale, Horizontal Correction and mean square error for X (RmsX), Y(RmsY) and Z (RmsZ).
Finally, the program will assign the coordinates and the scale calculated to the new standing station when the accept button is clicked. The total station will then be oriented to the azimuth calculated.
A report including the following data is automatically stored in the project folder. The name of this file includes the date and the time in which it has been created.
OBSERVATIONS
Distance Observations
Stand.St. Ctr.Pt. Observed Std.Dev. Calculated Residual
--------- --------- ---------- ---------- ---------- ----------
8 5 33.8860 0.0021 33.8856 0.0004
8 2 28.7770 0.0020 28.7765 0.0005
8 10 131.2810 0.0021 131.2811 -0.0001
8 11 78.9410 0.0021 78.9414 -0.0004
Azimuth Observations
Stand.St. Ctr.Pt. Observed Horz.Corr. Std.Dev. Calculated Remainder
--------- --------- ---------- ---------- ---------- ---------- ----------
8 5 0.0000 142.9262 0.0011 142.9260 0.0002
8 2 87.2200 142.9262 0.0012 230.1460 0.0002
8 10 188.9020 142.9262 0.0007 331.8279 0.0002
8 11 193.6440 142.9262 0.0008 336.5700 0.0002
Angular Observations
Stand.St. Ctr.Pt. Ctr.Pt. 2 Observed Std.Dev. Calculated Remainder
--------- --------- ---------- ---------- ---------- ---------- ----------
8 5 2 87.2200 0.0011 87.2200 -0.0000
8 5 10 188.9020 0.0008 188.9020 0.0000
8 5 11 193.6440 0.0009 193.6440 -0.0000
8 2 10 101.6820 0.0008 101.6819 0.0001
8 2 11 106.4240 0.0009 106.4240 -0.0000
8 10 11 4.7420 0.0008 4.7421 -0.0001
Vertical Observations
Stand.St. Ctr.Pt. Observed Std.Dev. Calculated Remainder
--------- --------- ---------- ---------- ---------- ----------
8 5 2.9969 0.0021 2.9964 0.0005
8 2 -0.1844 0.0020 -0.1846 0.0003
8 10 -5.0565 0.0021 -5.0556 -0.0009
8 11 -3.4036 0.0021 -3.4036 0.0001
COMBINATIONS
E1 E2 E3 X Coord. Y Coord. XY Error
--------- --------- --------- ------------ ------------ ------------
5 2 10 1000.0000 1000.0000 0.0014
5 2 11 1000.0000 1000.0000 0.0013
5 10 11 1000.0044 999.9967 0.0042
2 10 11 1000.0001 1000.0003 0.0015
Average X= 1000.0011 Average Y = 999.9992 Average Error = 0.0021
CONTROL POINTS
Ctr.Pt. X Coord. Y Coord. Z Coord. Ang. Error Dist. Error Height Error
---------- ------------ ------------ ------------ ------------ ------------ ----------------
5 1026.4700 978.8440 102.9970 0.0002 0.0004 0.0005
2 986.8770 974.3900 99.8160 0.0002 0.0005 0.0003
10 884.7870 1062.9340 94.9450 0.0002 -0.0001 -0.0009
11 933.7290 1042.8940 96.5970 0.0002 -0.0004 0.0001
RESULTS
Planimetric Adjustment
Solution: X = 1000.0000 X = 1000.0000 HC = 142.9260
Standard deviation of parameters: X = 0.0000 Y = 0.0000
Altimetric Adjustment
Solution: Z = 100.0006
Standard deviation of parameter: Z = 0.0003
Observation Equations
Each observation making up a resection can generate several equations among of the following:
Distance equations
Azimuth equation
Angle equation
Vertical equation.
Each equation is determined from an observation's data or from the relationship between two observations, as is the case with angle equations. The program determines which of the equations can be generated based on the data available. For instance, if an observation is just of distance, only such an equation will be created. If the observation is angular, the angle and azimuth equations will be created. In this way, better use is made of the data gathered.
Each equation affects the coefficient, residual and weighting matrices. The values of the A coefficient matrix depend on the type of equation and are based on linearization using Taylor series non-linear equations generated by the observations.
The L vector residual values are calculated by simply finding the difference between the observed and calculated values for each observation. This coincides with the data displayed in the program's information windows.
L~i~ = V~o~ - V~c~
where:
L~i~ = Residue
V~o~ = Observed value
V~c~ = Calculated value
Finally, the diagonal matrix P for weightings contains a factor which affects each equation and determines its fitness or precision.
Measurement uncertainties
Measurement uncertainty is a parameter associated with the result of a measurement which characterize the dispersion of values which could reasonably be attributed to the measurand. The less uncertainty about the measurement, the better.
There are two types of uncertainty:
Angle measurement uncertainty.
Distance measurement uncertainty.
Angle measurement uncertainty
ISO Standard 17123-3 sets out the procedure to be followed by a user to determine and evaluate the angle measurement uncertainty of the instrument used. Although the quality of the instrument measurement depends on various factors such as offset uncertainty, the angle resolution of the instrument, telescope magnification etc., ISO Standard 17123-3 does to set out to study each of these factors, but rather to ascertain the final effect produced by them all, evaluation the typical deviation of the measurement.
The expression of the combined typical uncertainty of an angle can be evaluated as:
Angle measurement contribution of the station
Pursuant to ISO standard 17123-3, the typical horizontal and vertical angle measurement uncertainty with a theodolite is expressed by means of the typical experimental deviation of the mean of a horizontal angle direction (σISO-HZ) and of the mean of a vertical angle (σISO-V). Hence, for a given angle direction the typical deviation of the measurement encompassing the traditional "accidental reading and aiming errors" will be:
The measurement contribution of horizontal angles will be used in the event of typical experimental deviation of the mean of a horizontal angle direction. In the same way as for vertical angles.
Contribution through stake centering
One of the sources of uncertainty in an angular or distance measurement occurs when the target sign is not perfectly centered. Its contribution to the uncertainty of the horizontal angle is:
where:
D = Distance measured.
ρ = Hundredths of seconds which have a radian: An approximation of this value is: 636619,772.
where:
Uo = a value of 0.75 mm has been assumed as this is the most appropriate value for current stations with optical or laser plummet.
It is divided by 3.5 to achieve a coverage probability of 99.7%
Contribution through instrument centering
One of the sources of uncertainty in an angular or distance measurement occurs when the total station is not perfectly centered at the station point. Its contribution to the uncertainty of the horizontal angle is:
where:
D = Distance measured.
ρ = Hundredths of seconds which have a radian: An approximation of this value is: 636619,772.
where:
Uc = a value of 0.75 mm has been assumed as this is the most appropriate value for current stations with optical or laser plummet.
It is divided by 3.5 to achieve a coverage probability of 99.7%
Contribution through stake inclination
One of the sources of uncertainty when a total station is observed directly at the center of the prism, when measuring a horizontal angle or the geometric distance, is its lack of verticality compared with the point on which it has stopped. Its contribution to the uncertainty of the horizontal angle is:
where:
m = Prism height.
β = Inclination angle of the target sign on the vertical; for its simplification, the value of 3\' has been assumed as the most likely maximum inclination we are going to have. This would correspond to the position where the bubble would be at a tangent to the circumference drawn:
It is divided by 3.5 to achieve a coverage probability of 99.7%
where:
D = Distance measured.
ρ = Hundredths of seconds which have a radian: An approximation of this value is: 636619,772.
Contribution through compensator accuracy
where:
 = Compensator accuracy in hundredths of seconds.
Distance measurement uncertainty
ISO Standard 17123-4 sets out the procedure to be followed to determine and the measurement uncertainty of a distance meter. Under this standard a simplified or complete procedure can be carried out in line with the needs of the user. As with ISO standard 17123-3, ISO standard 17123-4 seeks to ascertain the final effect caused by all the factors which contribute to determining the distance measurement uncertainty, evaluating the typical deviation of the measurement.
The expression of the combined typical uncertainty of distance can be evaluated as:
where:
 = Contribution by measurement of the geometric distance using electromagnetic methods.
Manufacturers usually present the uncertainty of their equipment by means of a constant part plus a part proportional to the distance measured ± (a mm + b ppm·D), which is a way of indicating the typical deviation for any distance. If the evaluation carried out by the manufacturer is used, appropriately applying the propagation of uncertainties, the typical measurement uncertainty (σISO-EDM) obtained when measuring a given distance D, it can be evaluated by means of:
where:
a = Constant part for the distance measured.
b = Proportional part for the distance measured.
D = Distance measured.
σo, σc, σj will be the same as those used in the combined typical uncertainty of angles
Slope measurement uncertainty
The expression of the combined typical uncertainty of a change in level can be evaluated as:
σISO-EDM, σo, σc, σj will be the same as those used in the combined typical uncertainty of distances
Hence, with the minimum square adjustment by observation equations, to construct the weight matrix P, for each value the inverse of the square of the typical deviation would be introduced in each case whether they are angle or distance measurements.
The standard deviation values are affected by the equipment configuration.
García Balboa, J. L. ,Ruiz Armenteros, A. M. & Mesa Mingorance, J. L. (2011). Evaluation of the measurement uncertainty of angles, distances and changes in level measured with topographic instrumentation. Mapping 149, 6-27.
Distance Equation
Distance type observations have the following information: source and target stations, distance observed, standard deviation and residue. The general formula is:
where:
Azimuth Equation
Azimuth observations consist of source and target stations, observed azimuth, calculated azimuth, standard deviation and residue. The general formula is:
where:
Angular Equation
Angular observations consist of source and target stations, observed angle, calculated angle, standard deviation and residue. The general formula is:
where:
I = current station
B = previous station
F = next station
Vertical equation
Vertical observations indicate the differences between the slope observed and calculated. The general formula is:
where:

García Balboa, J. L. ,Ruiz Armenteros, A. M. & Mesa Mingorance, J. L. (2011). Evaluation of the measurement uncertainty of angles, distances and changes in level measured with topographic instrumentation. Mapping 149, 6-27.
García-Asenjo, L., Hernández, D. & Llácer, C. (2004). Study about the influence of geodesic corrections on topographic works carried out as from classical measurements and GPS. 8th National Topography and Mapping Congress TOPCART2004.
Wolf, P.R. & Ghilani, C.D. (1996). Adjustment computations: statistic and least squares in surveying and GIS.
Brinker, R. C. & Minnick, R. (1995). The Surveying Handbook.
**