tcpMDT Photovoltaic
Draw trackers in 3D - PV25
8.2 Draw Trackers in 3D
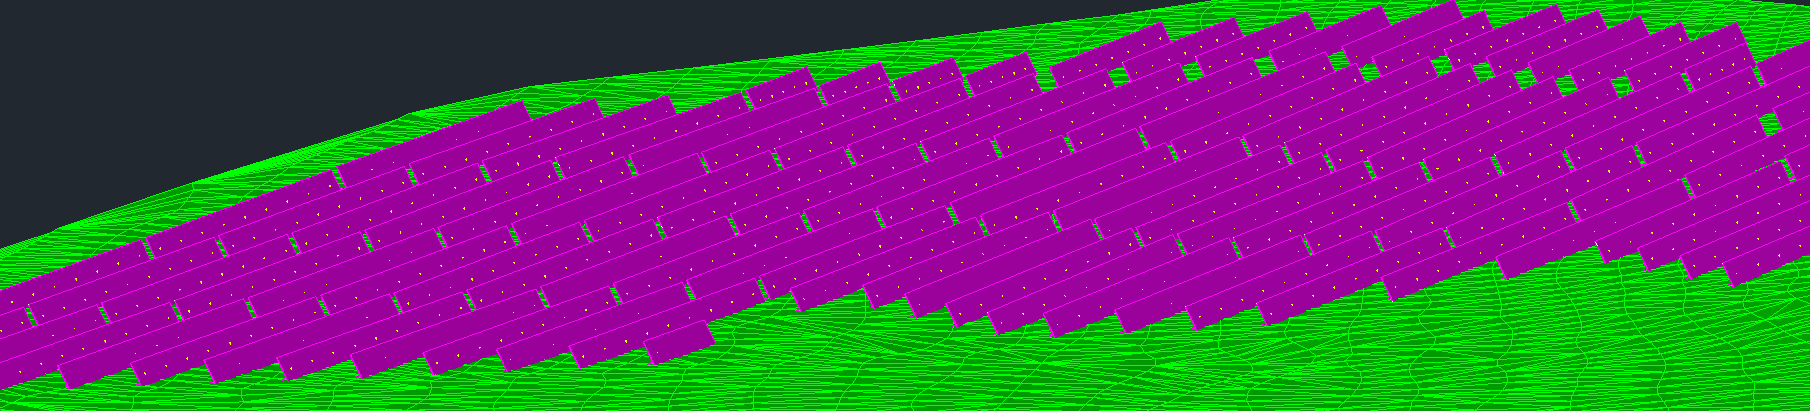
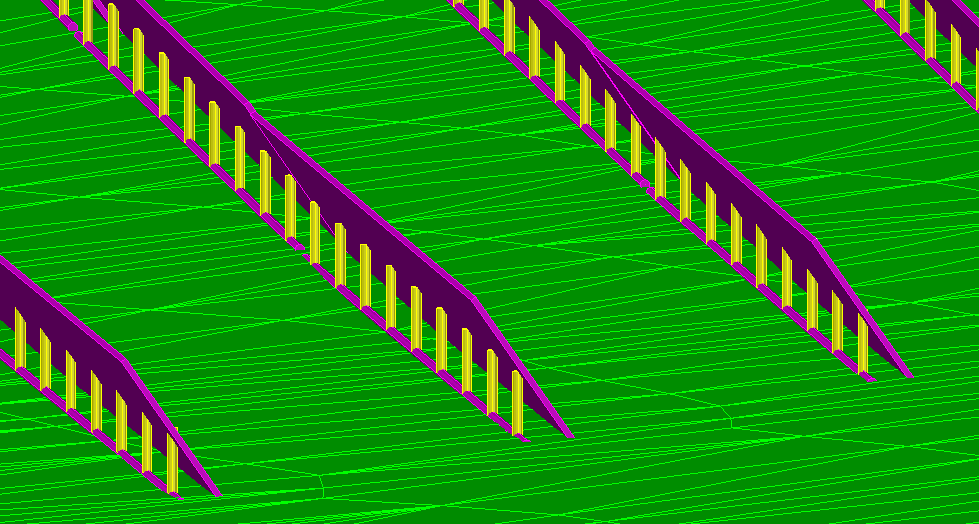
With this command we are going to make a 3D representation in the current CAD drawing. When executing this option, it will show us the following window in which we will set the different representation parameters.
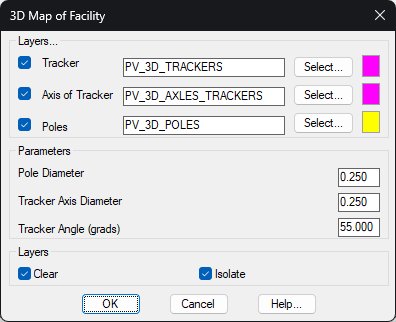
Layers
Tracker: If activated, indicate the name of the layer and the color in which it will be represented. The rectangle associated with it in plan is considered as a tracker.
Axis of Tracker: The layer and the color in which the tracker axis will be represented at the level of the tracker grade are indicated, i.e., the line that joins the poles points of the tracker poles.
Poles: Enable the representation of the tracker poles on a certain layer and with a certain color.
Parameters
Pole Diameters: Each pole is represented by a cylinder, indicating the diameter of the cylinder.
Tracker Axis Diameter: Likewise, it will also be represented with a cylinder, the diameter of the cylinder is specified.
Tracker Angle (degrees): with this parameter we simulate the tilt of the tracker\'s solar panels. The degrees of inclination are introduced, assuming that zero degrees would correspond to a horizontal distribution of the plates.
Clear: If we check this box, all the features contained in the layers that will be used for the 3D representation will be automatically deleted.
Isolate: If we activate this option, only the layers in which the objects to be drawn are located will be made visible, hiding the rest of the layers in the drawing.
The 3D representation can be made individually of a tracker, a group of them, selecting it by zones or of all the trackers of the project.