
tcpMDT
Measurement uncertainties - MDT25
29.3 Measurement uncertainties
Measurement uncertainty is a parameter associated with the result of a measurement which characterize the dispersion of values which could reasonably be attributed to the measurand. The less uncertainty about the measurement, the better.
There are two types of uncertainty:
-
Angle measurement uncertainty.
-
Distance measurement uncertainty.
Angle measurement uncertainty
ISO Standard 17123-3 sets out the procedure to be followed by a user to determine and evaluate the angle measurement uncertainty of the instrument used. Although the quality of the instrument measurement depends on various factors such as offset uncertainty, the angle resolution of the instrument, telescope magnification etc., ISO Standard 17123-3 does to set out to study each of these factors, but rather to ascertain the final effect produced by them all, evaluation the typical deviation of the measurement.
The expression of the combined typical uncertainty of an angle can be evaluated as:

where:
Angle measurement contribution of the station
Pursuant to ISO standard 17123-3, the typical horizontal and vertical angle measurement uncertainty with a theodolite is expressed by means of the typical experimental deviation of the mean of a horizontal angle direction (σISO-HZ) and of the mean of a vertical angle (σISO-V). Hence, for a given angle direction the typical deviation of the measurement encompassing the traditional "accidental reading and aiming errors" will be:
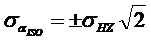
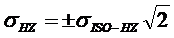
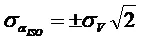
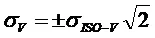
The measurement contribution of horizontal angles will be used in the event of typical experimental deviation of the mean of a horizontal angle direction. In the same way as for vertical angles.
Contribution through stake centering
One of the sources of uncertainty in an angular or distance measurement occurs when the target sign is not perfectly centered. Its contribution to the uncertainty of the horizontal angle is:
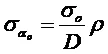
where:
D = Distance measured.
ρ = Hundredths of seconds which have a radian: An approximation of this value is: 636619,772.

where:
Uo = a value of 0.75 mm has been assumed as this is the most appropriate value for current stations with optical or laser plummet.
It is divided by 3.5 to achieve a coverage probability of 99.7%
Contribution through instrument centering
One of the sources of uncertainty in an angular or distance measurement occurs when the total station is not perfectly centered at the station point. Its contribution to the uncertainty of the horizontal angle is:
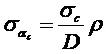
where:
D = Distance measured.
ρ = Hundredths of seconds which have a radian: An approximation of this value is: 636619,772.

where:
Uc = a value of 0.75 mm has been assumed as this is the most appropriate value for current stations with optical or laser plummet.
It is divided by 3.5 to achieve a coverage probability of 99.7%
Contribution through stake inclination
One of the sources of uncertainty when a total station is observed directly at the centre of the prism, when measuring a horizontal angle or the geometric distance, is its lack of verticality compared with the point on which it has stopped. Its contribution to the uncertainty of the horizontal angle is:
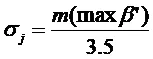
where:
m = Prism height.
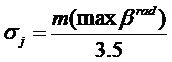
β = Inclination angle of the target sign on the vertical; for its simplification, the value of 3\' has been assumed as the most likely maximum inclination we are going to have. This would correspond to the position where the bubble would be at a tangent to the circumference drawn:
It is divided by 3.5 to achieve a coverage probability of 99.7%
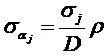
where:
D = Distance measured.
ρ = Hundredths of seconds which have a radian: An approximation of this value is: 636619,772.
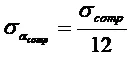
Contribution through compensator accuracy
where:
 = Compensator accuracy in hundredths of seconds.
Distance measurement uncertainty
ISO Standard 17123-4 sets out the procedure to be followed to determine and the measurement uncertainty of a distanciometer. Under this standard a simplified or complete procedure can be carried out in line with the needs of the user. As with ISO standard 17123-3, ISO standard 17123-4 seeks to ascertain the final effect caused by all the factors which contribute to determining the distance measurement uncertainty, evaluating the typical deviation of the measurement.
The expression of the combined typical uncertainty of distance can be evaluated as:

where:
 = Contribution by measurement of the geometric distance using electromagnetic methods.
Manufacturers usually present the uncertainty of their equipment by means of a constant part plus a part proportional to the distance measured ± (a mm + b ppm·D), which is a way of indicating the typical deviation for any distance. If the evaluation carried out by the manufacturer is used, appropriately applying the propagation of uncertainties, the typical measurement uncertainty (σISO-EDM) obtained when measuring a given distance D, it can be evaluated by means of:

where:
a = Constant part for the distance measured.
b = Proportional part for the distance measured.
D = Distance measured.
σo, σc, σj will be the same as those used in the combined typical uncertainty of angles

Slope measurement uncertainty
The expression of the combined typical uncertainty of a change in level can be evaluated as:

σISO-EDM, σo, σc, σj will be the same as those used in the combined typical uncertainty of distances

Hence, with the minimum square adjustment by observation equations, to construct the weight matrix P, for each value the inverse of the square of the typical deviation would be introduced in each case whether they are angle or distance measurements.

The standard deviation values are affected by the equipment configuration. See the Customization Manual for further details.
García Balboa, J. L. ,Ruiz Armenteros, A. M. & Mesa Mingorance, J. L. (2011). Evaluation of the measurement uncertainty of angles, distances and changes in level measured with topographic instrumentation. Mapping 149, 6-27.
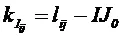
Distance Equation
Distance type observations have the following information: source and target stations, distance observed, standard deviation and residue. The general formula is:

where:

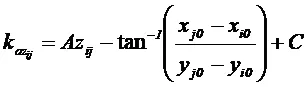
Azimuth Equation
Azimuth observations consist of source and target stations, observed azimuth, calculated azimuth, standard deviation and residue. The general formula is:

where:

Angular equation
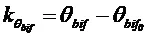
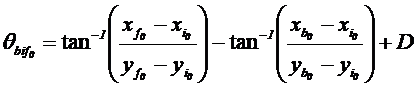
Angular observations consist of source and target stations, observed angle, calculated angle, standard deviation and residue. The general formula is:


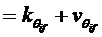
where:
I = current station
B = previous station
F = next station


Vertical equation
Vertical observations indicate the differences between the slope observed and calculated. The general formula is:
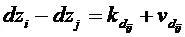
where:

- García Balboa, J. L. ,Ruiz Armenteros, A. M. & Mesa Mingorance, J. L. (2011). Evaluation of the measurement uncertainty of angles, distancies and changes in level measured with topographic instrumentation. Mapping 149, 6-27. (http://coello.ujaen.es/publicaciones/Garcia-Ruiz-Mesa_2011_Mapping_Evaluacion_incertidumbre.pdf , last access: August 2013)
- García-Asenjo, L., Hernández, D. & Llácer, C. (2004). Study about the influence of geodesic corrections on topographic works carried out as from classical measurements and GPS. 8th National Topography and Mapping Congress TOPCART2004.
- Wolf, P.R. & Ghilani, C.D. (1996). Adjustment computations: statistic and least squares in surveying and GIS.
- Brinker, R. C. & Minnick, R. (1995). The Surveying Handbook.
Adjustment fitness test. Chi-Square
Chi-square distribution is a probability tool which is used in hypothesis testing. In the event of a minimum square adjustment, the original observations are compared with the adjusted ones and they are evaluated taking into account the differences they manifest between each other.
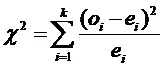

In view of a significance level α a critical value is defined for rejecting the proposed hypothesis Ho=f(x)=fo(x).
If the original observations are not significantly different from the adjusted ones calculated by means of the proposed model, then the statistical testing value χ2 will be near zero, but if these differences are significant, then the statistical value χ2 will be in the reject Ho region

reject Ho <=> > :
 Reject Ho region
The Value to be compared of Chi-square is shown in a table which depends on the confidence interval and the degrees of freedom of the adjustment.
Internal Reliability Test. Baarda
Internal reliability is taken to mean the detection and control of any possible coarse errors in the observables. In those way it is possible to ascertain network sensitivity to any coarse errors.
To study the internal reliability of the network we will use the following parameters:
Redundancy of each observable
Baarda Parameter
Minimum detectable error
Redundancy of each observable
The redundancy of an observable is a dimensionless parameter and they show us the good or bad controlled by said observable. The expression which allows us to calculate the number of redundancies of an observable is:

where:
r~i\ =~ Redundancy of any observable.
p~i\ =~ Weight of an observable.
q~i\ =~ Residue cofactor a posteriori of the observable.
Baarda Parameter
This parameter depends on the level of significance end the test power set for the network. A significance level of 99.99 % - = 0.001 - has been set and a test power for coarse error detection of 80% - = 0.2 -- as they have been assumed as more suitable values for the efficiency of this test. The Baarda parameter is obtained from the following expression:

where:
Vi = Residues vector
σRi= Typical deviation of the residues
The Baarda parameter, along with the minimum detectable error, is some of the coefficients used to reject or eliminate an observable. What\'s more, this parameter allows the gross errors introduced into the network to be controlled.
In this way an observable will be rejected when the value of the Baarda parameter is greater than the percentage point (3.2905) set for the significance level.
Minimum detectable error
The minimum detectable error for an observable is obtained from the following expression:
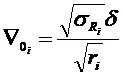
where:
δ = Translation parameter
As we can observe, this parameter is determined in line with the translation parameter which is corresponded to the displacement produced in the Gauss campaign owing to the coarse error.
Essentially, these parameters are determined for a significance level and for a data test power, ensuring that a correct observable will not be rejected, with a probability of 99.9 % and any such possible gross errors will be detected with a test power of 80 %, meaning that 20% thereof could be introduced into the adjustment.