
tcpTunnel CAD
Curvature diagram - TNC3
15.4 Curvature Diagram
When an axis file (.eje) is loaded in the application, a floating curvature diagram window is displayed alongside the superelevation editor. This diagram shows the curvature of the axis along the station range, providing a reference for defining the superelevation values.
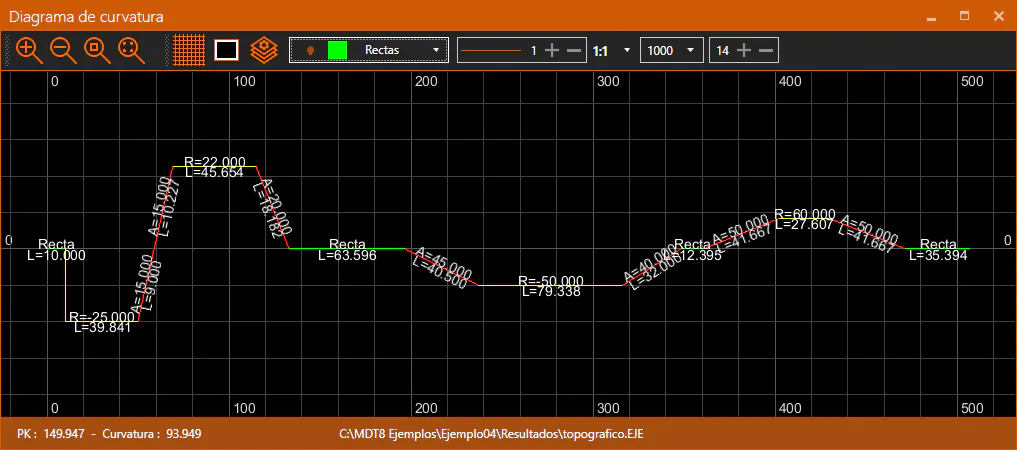
The curvature diagram has its own toolbar with the following controls:
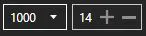
Curvature factor: Sets the vertical scaling factor for the curvature diagram, allowing adjustment of the visual amplitude of the curvature representation.
Text height: Sets the size of the annotation text in the curvature diagram.
The curvature diagram uses the following color scheme:
- Green: Straight segments (zero curvature).
- Red: Clothoid segments (transition curves).
- Yellow: Circular curve segments.
The status bar of the curvature diagram shows the current station and curvature values corresponding to the position of the cursor within the diagram.