
tcpMDT Photovoltaic
Continuous drawing of trackers in profile view - PV25
7.3 Continuous Drawing of Trackers in Profile View
With this tool, you can continuously draw all the trackers in the same column, within a zone. This option is especially useful for graphically visualizing the elevation difference between neighboring trackers.
In this case, the selection of the tracker automatically leads to the automatic selection of all the trackers that are in the same column, so that the user only has to select one tracker from the column they want to represent, being indifferent the selected tracker.
When executing the command, it will ask us if we want to select individually or multiple. In the latter case, as in the previous option, they will be drawn in the same column after introducing the vertical separation between them.
You can then view the result of the drawing.
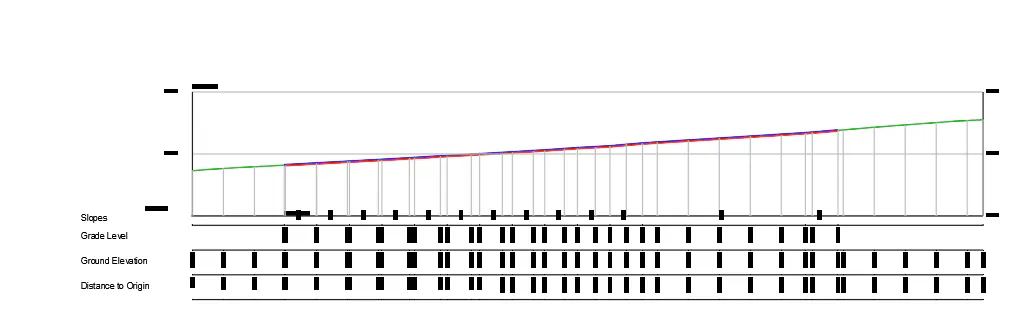
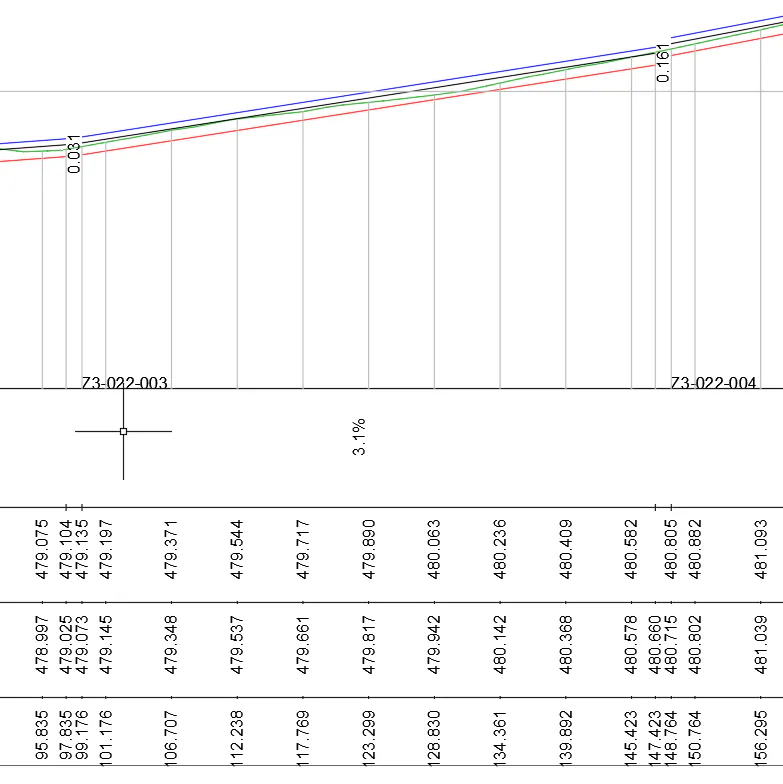
In the second image, an extension of the first one can be visualized as the difference in elevation between consecutive trackers and the name of each tracker is labeled in the comparison plane.