
tcpMDT
Direct intersection - MDT25
25.22 Direct Intersection
This calculation method can be applied when the result was obtained by the intersection of observations from other instrument set-ups and the reference station, using at least two horizontal observation data. This utility is accessed through the Surveying > Utilities > Direct Intersection command. The program requests the station to be processed. Additionally, this option can also be accessed by clicking the Direct Intersection button in the Station Calculation screen displayed in Advanced mode. It is understood that the station currently on screen is being calculated.
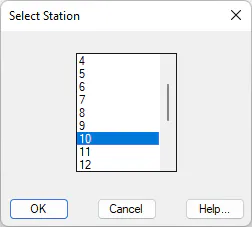
The program then requests the station to be calculated and displays a window showing information on all the observations from the station to be calculated, along with a schematic representation of each one.
One can select the calculation method by choosing between Angles Only, Distances Only and Angles and Distances. 2D or 3D calculations can also be specified by clicking the appropriate buttons.
The program displays a simplified representation of the calculation in the top left-hand window, consisting of a circle indicating the solution found, lines coming out of it drawing the angle observations should they be enabled (Only Angles or Angles and Distances modes), and some circles that express the distance observations should they be enabled (Only Distances or Angles and Distances modes). The color of each of these observations corresponds to its position on the observation list with the CAD color number system: red of the first, yellow for the second, etc. Should there be more than seven observations, color assignment starts again from the beginning.
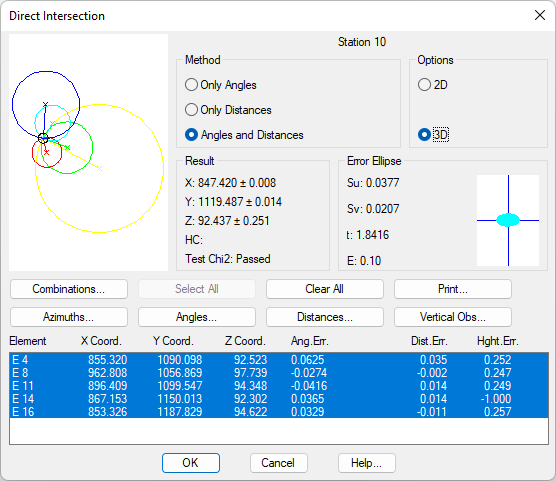
It is possible to activate or deactivate an observation for calculation purposes, by selecting one from the on-screen list. The observation's representation changes to broken lines. The Select All button allows one to choose all the elements observed, even when they may be beyond the admissible error tolerance range. The Clear All command deselects all the observations considered.
The Azimuths, Distances, Angles and Vertical Obs buttons display on-screen on lists corresponding to the azimuth, distance, angle and vertical equations used in the calculation that were obtained from observations between stations. This information may be edited or printed. Consult the Basic Concepts and Traverse Adjustment sections for further details.
If the Goodness-of-fit test has been enabled under the Least Squares option within the Surveying configuration, the Results frame will be shown if the Chi-Square test has been passed or not. Furthermore, in the lists of distance, azimuth, angular and vertical observations, a column is added with the reliability level resulting from the Baarda *Test*. In this case the values may be: perfect, good, poor, bad or incorrect.
The calculation process consists of the gathering provisional coordinates by means of an initial approximation and subsequently adjusting them using the least squares method.
Combinations
The initial approximation is calculated by averaging out the combinations of calculated observations two by two whose error is less than the maximum admissible tolerance. This information can be viewed by the clicking the Combinations button. In addition to the coordinates obtained from each combination, the program shows the error associated with the averaging out process and the total average error. One can likewise modify initial approximation coordinates by changing the X* Coordinate and Y Coordinate*** fields.
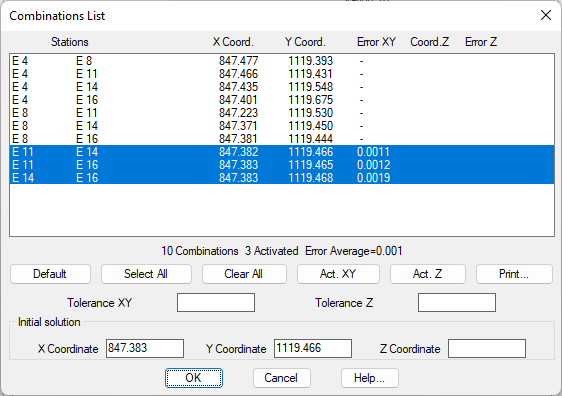
All the combinations can be activated, so that they are included in the calculation by clicking Select All, as well as deactivating them by clicking the Clear All button. Lastly, the Default button restores the original calculation observations, i.e. those whose error margins are within the tolerances set in the configuration. The Print button displays a list in the following format:
COMBINATIONS LIST
E1 E2 E3 X Coord. Y Coord. Error
S 11 S 12 927.257 1158.367 0.490*
S 11 S 6 927.487 1158.805 0.005
S 11 S 15 927.482 1158.797 0.005
S 11 S 16 927.463 1158.761 0.046*
S 12 S 6 927.485 1158.806 0.005
S 12 S 15 927.481 1158.798 0.005
S 12 S 16 927.462 1158.761 0.046*
S 6 S 15 927.587 1158.730 0.126*
S 6 S 16 927.638 1158.692 0.189*
S 15 S 16 927.660 1158.683 0.213*
X Average=927.484 Y Average=1158.801 Average Error=0.005
It can be seen that all the combinations are included. The ones used in the calculation are denoted by an asterisk (*). The X* Coordinate and Y Coordinate*** boxes allow to directly enter the coordinates to be used for the initial approximation before the adjustment is performed. It must be remembered that the least squares adjustment method will normally find the optimum solution only if the initial approximation is not too far from the definitive one. At times, it may be necessary to change these values manually.
Results
Lastly, the screen representation consists of the ellipse error drawing and its numerical data, including: major semi-axis (Su), minor semi-axis (Sv), orientation (t), and screen representation scale (E).
This information is obtained by clicking the Print button, which has these options: observation data (See Traverse Calculation), combinations (See previous list), control stations and results.
CONTROL BASES
Element X-Coord. Y-Coord. Z-Coord. Ang.Error Dist. Error Elevation Error
E 2 299949.759 4000031.202 97.563 -0.0661 -0.051 0.001
E 5 299989.327 4000035.783 100.746 -0.0677 0.038 0.001
E 11 299896.409 4000099.547 94.348 0.0253 -0.057 -0.001
E 10 299847.406 4000119.451 92.684 -0.1813 -0.020 -0.001
RESULTS
Planimetric Adjustment
Calculation by Angles and Distances
Solution: X: 299962.864 Y: 4000056.870
Standard deviation from the parameters: X: 0.0260 Y: 0.0293
Error Ellipse: Su: 0.0866 Sv: 0.0676 Orientation: 366.0464
Chi-Square Test
Degrees of Freedom: 12 Chi2: 6.1177e-005
Confidence Interval: 95 % Passed
Altimetric Adjustment
Solution: Z: 97.729
Standard deviation from the parameter: Z: 0.0006
Once the calculation has been completed and the OK button clicked, the program assigns the coordinates obtained to the station and displays they were obtained by the direct intersection method.