
tcpMDT
Plots - MDT26 (2)
 | Command to execute in the CAD |
|---|---|
Vertical menu | MDT26 > Measurements > Volumes > Plots |
Ribbon menu | |
Command line |
With this command, the user can calculate the earthwork volumes for a set of plots based on two surfaces.
When the command is executed, MDT automatically reads all plots defined in the drawing (to define plots, refer to the Plots section of the Reference Manual). If no plotsare found in the drawing, the command will terminate automatically. Therefore, it is necessary to define the plots to be analyzed before running this command.
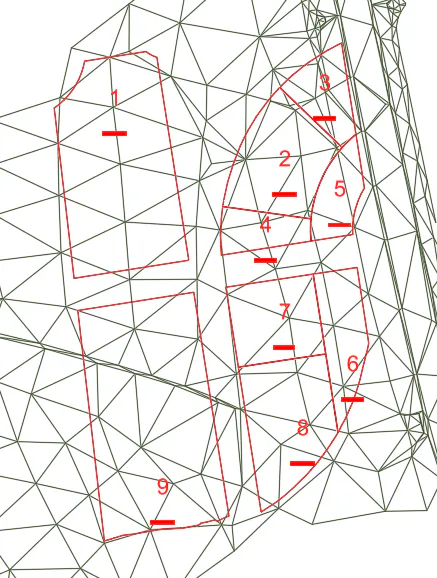
Una vez detectadas las parcelas existentes en el dibujo, nos aparecerá la siguiente ventana que a continuación pasamos a describir:
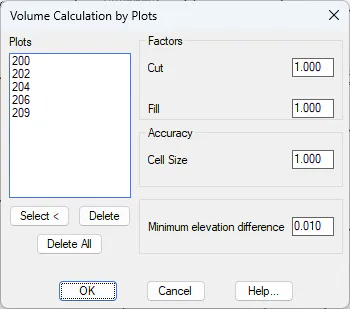
Plots: Names of the plots detected in the drawing for which the volume calculation will be performed. The user may also use the "Select" or "Delete" options to customize the parcel list.
Factors: These values are applied as multipliers to the calculated results of the respective surfaces. They may be used to account for soil swell or compaction factors in the earthwork volume calculation.
Cut: Multiplication factor applied to the cut surface.
Fill: Multiplication factor applied to the fill surface.
Cell Size: For volume computation, MDT internally generates a mesh for each surface. This parameter defines the cell size used to create the mesh.
Minimum Elevation Difference: Minimum elevation difference, in meters, required for the volume calculation to be considered. In other words, areas where the elevation difference between the two surfaces is less than this parameter will not be included in the surface or volume computation and will therefore be treated as null or zero.
Once this dialog box is confirmed, the program displays the complete volume calculation results for each plot:
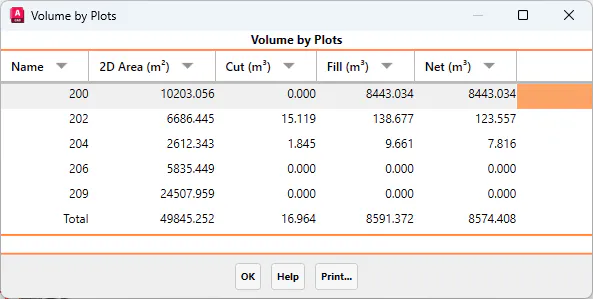
After closing the report, the following dialog box will appear, providing the option to draw the volume calculation results:
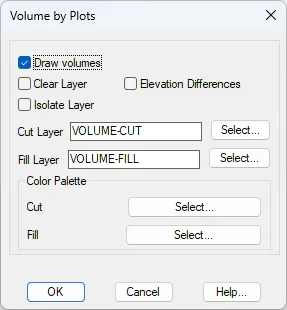
By enabling the Draw Volumes option, a graphical representation of the results can be generated. This representation consists of a mesh defined only within the area where both mesh files overlap. Each cell is assigned a color indicating whether the area corresponds to cut, fill, or no significant volume contribution within the tolerance defined in the settings.
The user may also assign different color ranges in the drawing for both cut and fill areas by selecting the corresponding color palette.
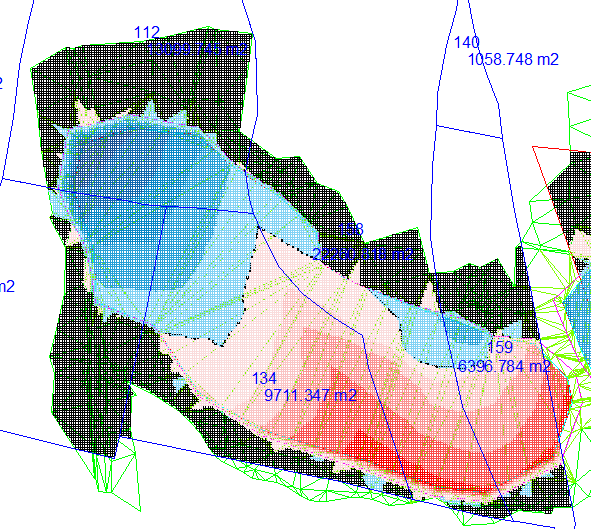
If the Elevation Differences option is also enabled, a text label showing the elevation difference between both meshes will be displayed inside each cut or fill cell.