tcpMDT
Draw Simple Long Section - MDT26
Draw Simple Long Section
 | Command to execute in the CAD |
|---|---|
Vertical menu | MDT26 > Profiles > Draw Simple Long Section |
Ribbon menu | L.Sections > Drawing > Draw Simple |
Command line |
This option allows one to draw on screen a long section of the terrain obtained previously by any of the procedures provided by MDT. It should not be confused with the Profiles > Draw Compound Profile command, which can also draw the grade line, along with the curve and superelevation diagrams.
Once the command is executed, it will request a .LON, .SEG or .TRA file, and the following dialog box will be displayed. If a segment file is selected, MDT will only extract the information concerning the long section.
In the case of selecting a cross-sections file, a long section will be generated internally from the alignment position, from which the drawing will be made.
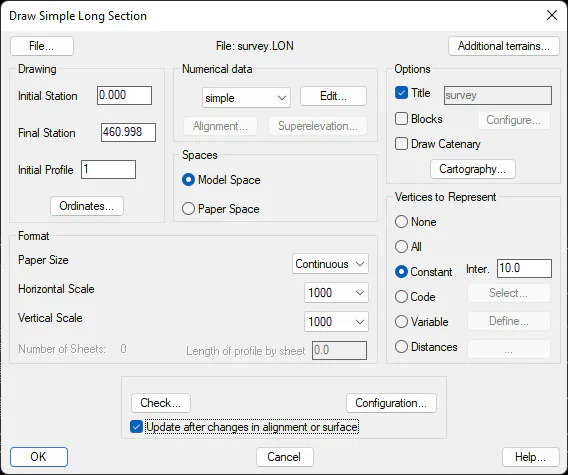
The window is comprised of the controls described below:
Drawing
Initial Station: Initial station from which one wishes the drawing to be made. It has the default initial value of the long section selected.
Final Station: Station up to which one wishes to draw the profile on screen. By default, it is the profile's maximum station.
Initial Profile: Represents the initial profile to be represented in the Profile Numbering element defined previously in the numerical data (see Longitudinal > Definition of Numerical Data).
Numerical Data
We select the numerical data associated with the profile that is to be represented; the different numerical data defined by the user is available in the drop-down menu.
Edit: To edit the active numerical data with the possibility of making modifications to it.
Alignment: In the case of adding the element "Curvature Diagram" to the numerical data, this button is used to select the horizontal alignment from which the corresponding diagram will be generated.
Superelevation: In this case, if we add the element "Superelevation", the superelevation will be taken as a reference in its drawing.
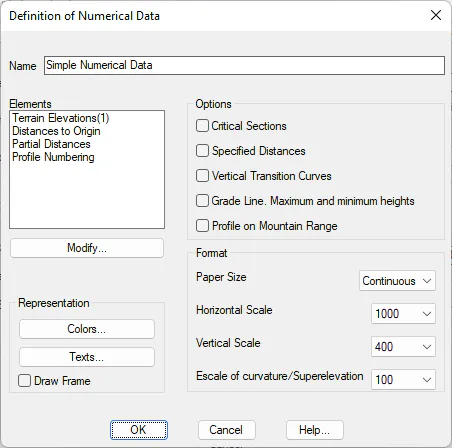
Next, we can see the dialogue box that appears when editing the numerical data. In the section Definition of Numerical data its function and characteristics are described.
Spaces
If Model Space is selected, the profile's drawing will be drawn normally, that is from the initial point selected on screen.
Should Paper Space be selected, it will be drawn using the pre-set paper space option in CAD.
The program will assign a Title to each of the presentations it creates preceded by the "LON_" prefix and ending with an index corresponding to the number of sheets. For instance, LON_ROAD1.
Additionally, should a representation already exist with the same name, the program will issue a warning that it already exists and ask whether the user wishes to delete it or create it again.
Draw in a different window: If this option is activated, it will allow us, using the viewports tool, to render in two windows. In this way, in one of them the drawing will be displayed with the current zoom, before the profile is rendered, and in the other window the selected longitudinal will be displayed.
Options
Title: Once the profile is drawn, the title entered will appear on the top of the drawing.
Blocks: This option allows one to select the blocks one wishes to draw on the long section. At the same time, the Blocks numerical data element should be defined in the numerical data definition to be used
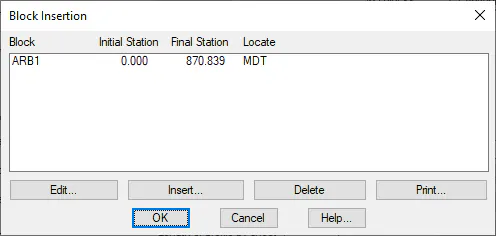
If the Configuration button is clicked, the following window is displayed where the insertion point of each of the blocks one wishes to insert along with the long section should be specified.
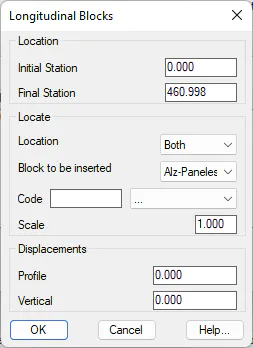
The following dialog box is displayed to insert or modify blocks for the long section drawing.
Everything concerning the definition and management of blocks is explained in greater detail in the Blocks Definition section.
Cartography: This option will allow us to visualize the cartography on the long section drawn. This option is available only when the drawing is done in a particular sheet format.
It has the following configuration parameters:
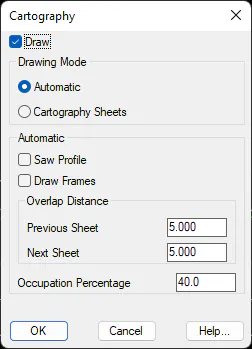
Draw: If this option is enabled, we activate the representation of the cartography.
Drawing Mode
Automatic: The cartography to be inserted will be calculated automatically according to the size of the selected sheet.
Cartography Sheets: If this option is selected, the previously defined sheets will be projected in the profile drawing with the command Long Section > Drawing > Draw Cartography Sheets.
In the case of selecting the Automatic option, the following parameters would be considered for the drawing of the cartography.
Saw Profile: The polyline that represents the long section. In the event that it does not have space for the drawing, will be drawn in sections, changing the comparison plane.
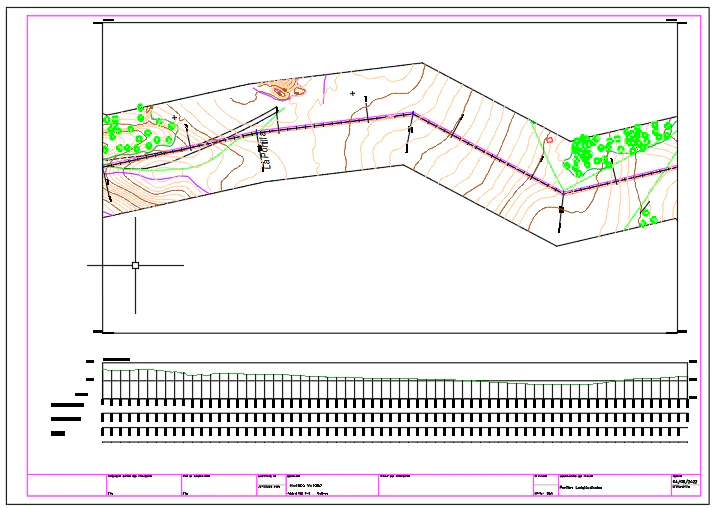
Draw Frames: Each section of cartography drawn on each sheet is drawn on a frame where the actual coordinates of the sheet are specified. In the image below, you can see the drawing of the frame.
Overlap Distances. With this option we get the leaves to overlap with each other a certain length.
Occupation Percentage: Percentage that the cartography will occupy in the selected paper format.
Draw Catenary: when you activate this box, the catenary associated with the long section will be drawn. By default, the "Power Lines" style will be configured by default. When validating the dialog, the command will ask the user for the file where the catenary information is stored.
Profile Length: This control will only be activated if the drawing is made on hard copy, in which case MDT will calculate the maximum length that can be drawn on each sheet depending on its format. The possibility exists of modifying this distance to adjust or give more margin to the representation.
Format
Paper Size: This check box is used to select the size of the paper. One can choose among the different formats contemplated for sheet distribution (defined in the HOJAS.DAT file). If one does not wish to split the drawing, the Continuous option (default value) should be selected.
The option exists of modifying the formats proposed regarding their names, size and contents. In order to do so, the blocks in the BLOQUES\FORMATOS folder of the program's root directory should be modified.
Concerning scale fields, it is necessary to consider that the drawing's scale is determined by text size in CAD, as the drawing is only generated in a scale of 1:1 and proportionally to the horizontal / vertical relation.
Horizontal Scale: This drop-down list displays all the scales defined in the ESCALAS.DAT file in the MDT configuration directory. It is possible to complete the list with other usual values.
Vertical Scale: Same as the previous paragraph. The possibility of defining a vertical scale on the cross-section drawings has been thought up to make it possible to observe height differences in very long profiles having very small height differences without having the need to continuously enlarge the drawing on screen.
If a sheet format is selected by the scale command, the number of sheets needed for the long section drawing can be viewed.
Vertices to Represent
When a long section is represented, a series of vertices are represented. In this section one selects the vertices to be represented and the interval with which they are to be represented. Different options exist, which are described below.
None: No cut is represented on the profile's horizontal alignment. Only the long section will appear with the numerical data lines, without any text lettering.
All: Represents all the cuts in the long section.
Interval: Represents the longitudinal cuts at constant intervals.
Codes: Only represents those cuts where the codes selected are present. These codes are configured by activating the Select button.
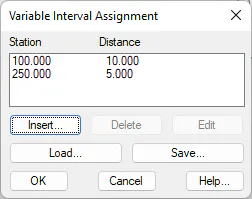
Variable: It will allow us to represent certain intervals between stations. In the next figure it will be represented every 10 meters up to station 100 and every 5 meters up to station 250.
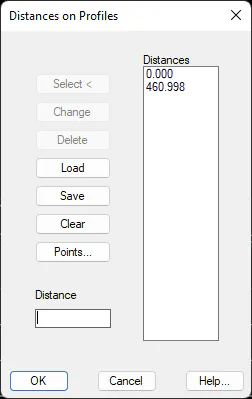
Distances: We introduce a certain distance in which we want to generate the presentation. Several options are available for the introduction of these distances.
Terrain
It is possible to draw several long sections at the same time on a same comparison plan with this option. In order to do so, the long section initially selected will appear by default. Then one can insert as many long sections as one wishes to add to the representation. The window shown below is then displayed when this command is activated:
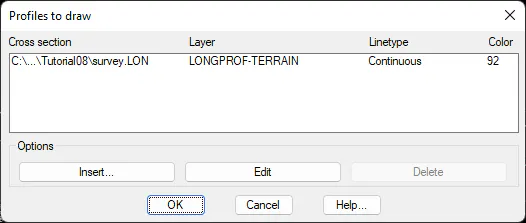
As you can see, you have the option of configuring the Layer, Line Type and representation Color of the corresponding long section.
Ordinates
This option controls the representation of both the comparison plan and separation in ordinates. When this button is clicked, the following window is displayed, which is described below:
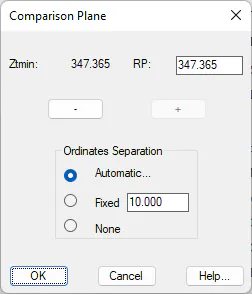
Comparison Plan: MDT proposes the comparison plan's height (it can be seen with the text Ztmin) by default. Its height can be changed by using the + or - buttons. The height increases or decreases when these buttons are clicked are directly related to the vertical scale selected on the numerical data.
Ordinate Separation: This control sets the separation of ordinates or, in other words, terrain elevation marks. Three different options exist:
Automatic: Depending on the drawing's scale, the program sets a suitable separation.
Fixed: The interval with which the terrain heights should be represented is set.
None: No information is displayed on terrain height ordinates.
Check
If we press this button it will take us to the revision of the long section. Consult the Check Long Section command.
Update After Changes to the Axis or Surface
If we activate this option, in the event that the user makes any change in the alignment or surface from which the long section has been generated, it will be updated automatically, both the drawing with the file of the profile.
Configuration
By pressing this button, we will access the configuration of the long section where, among other parameters, you can change the style of representation of the numerical data between the different styles available. For more details consult the Customization Manual.
Final Result
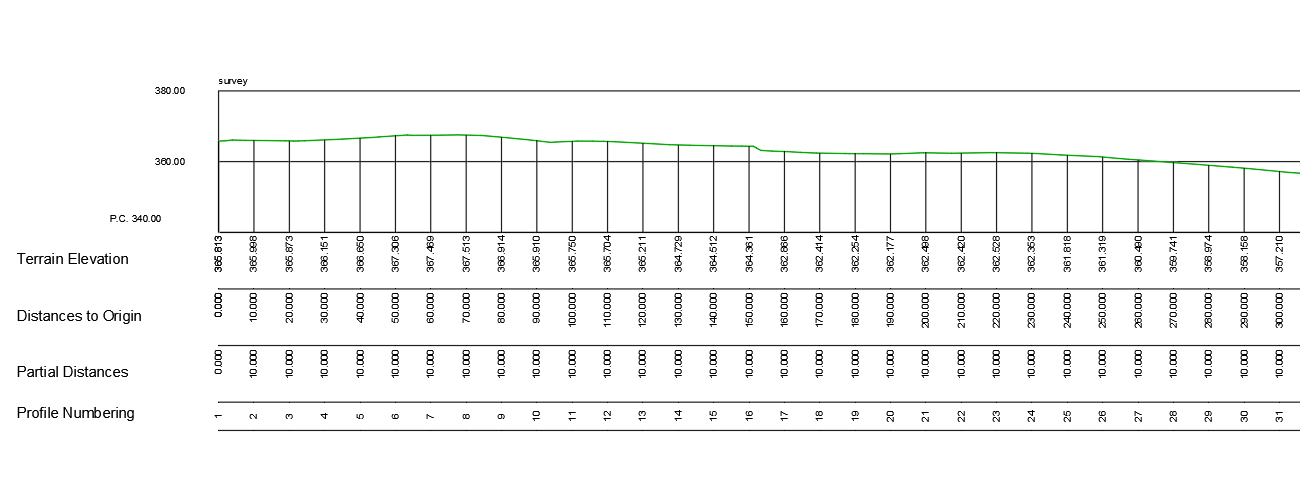
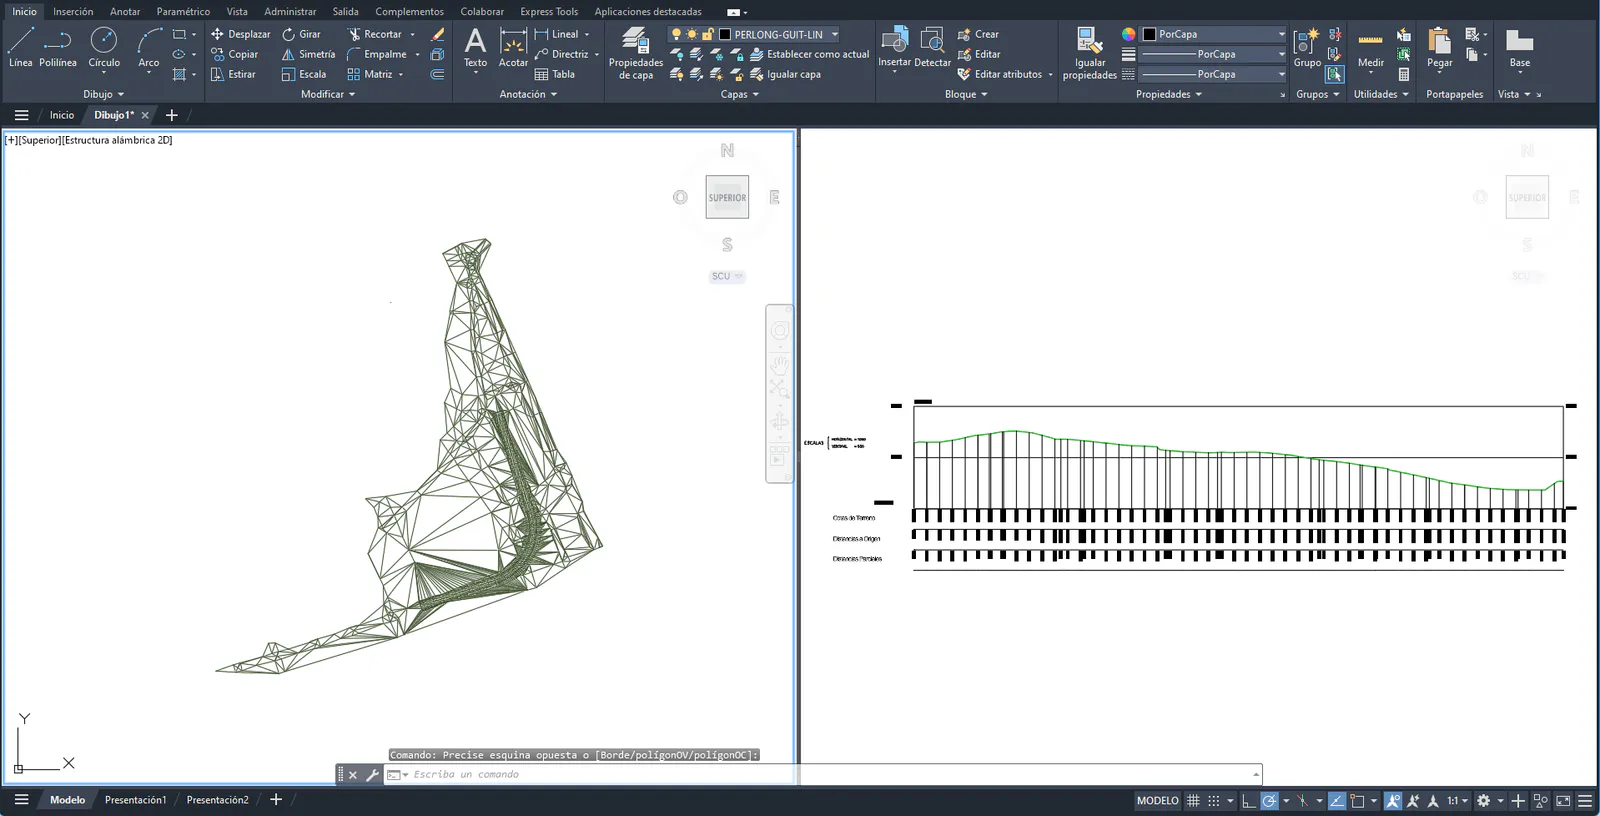
Once the dialog box has been validated, MDT requests a point on screen from which the long section will be represented. These points can be selected with either the mouse or by entering data in the command line. The final result of a longitudinal drawing can be seen below.
Furthermore, if we select "Automatic" as a drawing option the program will draw the profile in the first free area to the right of the current drawing.