
tcpMDT
[PRO] Draw Cross Sections - MDT26

Draw Cross-sections
 | Command to execute in the CAD |
|---|---|
Vertical menu | MDT26 > Cross-sections > Draw Cross-Sections |
Ribbon menu | X.Sections > Drawing > Draw |
Command line |
When this command is executed, either the natural terrain cross-sections (.TRA extension), skew profiles (extension .TRE) or the segment containing all the information on the road generated (see Definition of Segment in the Alignments section) is drawn.
When this command is executed, the program initially displays the .TRA and .SEG file templates and goes to the last folder used. By selecting or keying in a name, one goes to the parameter definition window, where the different options applied to drawing cross-sections can be configured.
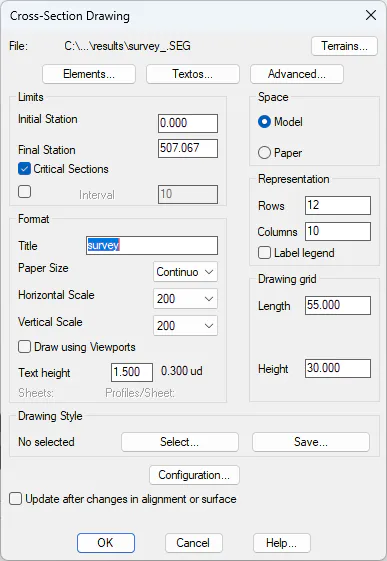
Update After Changes in Alignment or Surface
If we activate this option, in the event that the user makes any change in the alignment or surface from which the profiles have been generated, they will be updated automatically, both the drawing with the cross-sections file.
Once all the window's parameters have been set, the source of the top left corner where one wishes to commence their representation is requested. The profile matrixes are then drawn from left to right and top down depending on the drawing direction set.
For continuous format drawings, the project's title and reference are displayed on top left-hand corner. If any of the formats available is selected, the profiles will be distributed on the sheet selected, and as many sheets as may be necessary will be inserted. Each of the sheets contains a series of attributes detailing the drawing's characteristics: horizontal and vertical scales, title, reference, sheet number, total number of sheets and date. To change or create new sheets or attributes, see the Customization Manual.
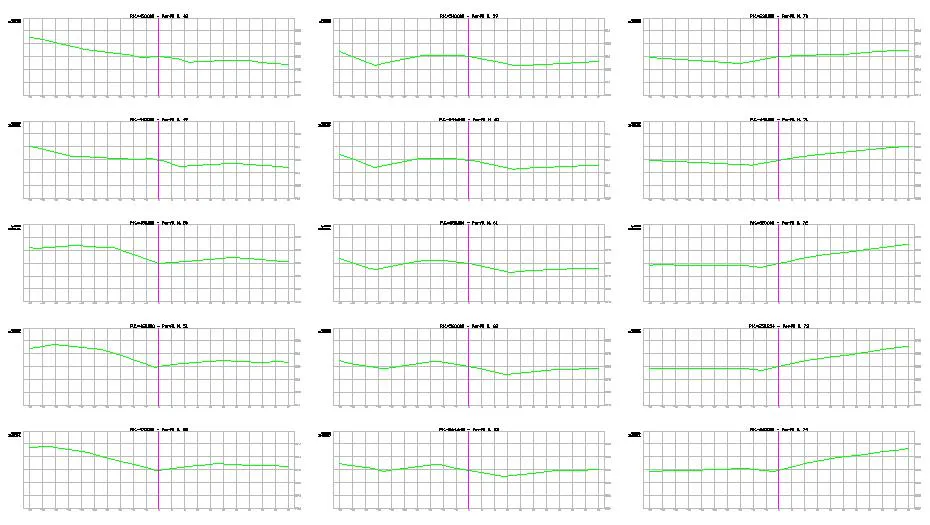
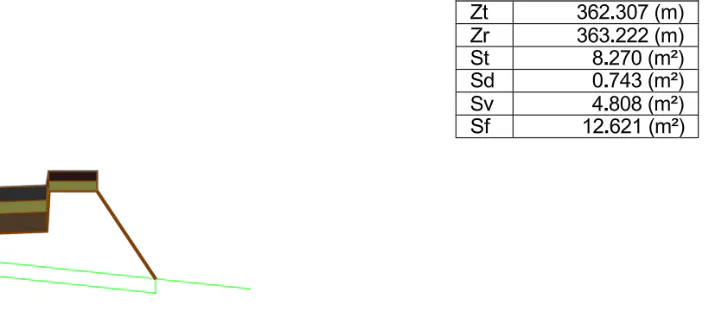
The following image shows an example of cross-sections drawn:
And this image shows an example of a segment drawn:
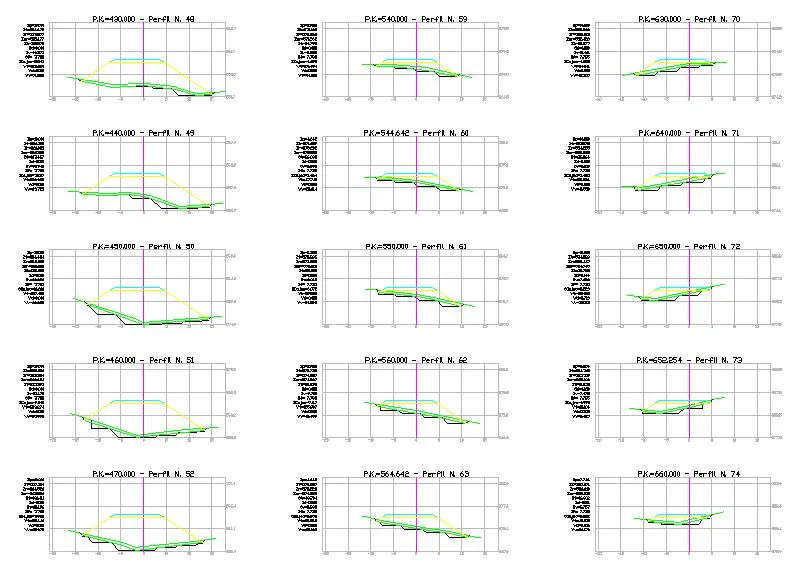
The controls in this dialog box are described below.
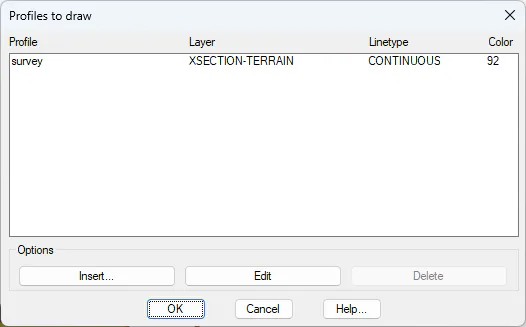
Terrains
With this option, the different terrain models to be drawn can be managed. Multiple cross-sections may be displayed simultaneously as required, with the ability to customize the color, layer name, and line type used for the representation of each cross-section file.
Limits
Initial Station: This field indicates the station from which the profiles will be represented. It may be modified if the user wishes the profile drawing to start at a later station.
Final Station: Conversely, this field displays the last profile contained in the selected file. This value may also be modified if the user wishes to end the representation at a station prior to the last one.
Critical Sections: Available only for segment drawing. This option allows the user to choose whether or not to display the alignment critical points.
Interval: This option allows the user to define the desired representation interval, provided that the stations of the cross-sections to be drawn exist.
Format
If Model Space is selected, the profile will be drawn in the standard manner, starting from the origin point specified on screen.
If Paper Space is selected, the drawing will be generated using the CAD paper space layout functionality.
For this option, the program assigns each created Paper Space Layout the specified title preceded by the prefix "LON_" and followed by an index corresponding to the sheet number. For example: LON_PATH1.
In addition, if a Paper Space Layout with the same name already exists, the program will display a warning message asking whether the existing layout should be deleted and recreated.
Format
Title: Once the profile has been drawn, the entered title will appear at the top of the drawing.
Paper Size: This option defines the drawing boundary used for the representation. Different sheet formats available for layout distribution may be selected (as defined in the HOJAS.DAT file). If the drawing is not to be divided into sheets, the Continuous option should be selected (default value).
The proposed formats may be modified in terms of name, size, and content. To do so, the blocks located in the BLOCKS\FORMATS directory within the program root folder must be edited.
For the scale fields, it is important to note that the drawing scale in CAD is determined by the text size, since the drawing is generated only at a 1:1 scale, together with the horizontal-to-vertical proportion ratio. The default value for both scale fields is 1:200.
Horizontal Scale: This drop-down list displays all scales defined in the ESCALAS.DAT file within the MDT configuration directory. Additional commonly used scales may also be added to the list.
Vertical Scale: Defined in the same way as the previous option. The possibility of assigning a vertical scale in cross-section drawings is intended to improve the visualization of long profiles with small elevation differences, making such variations easier to observe without requiring continuous zoom operations.
Text Height: Defines the height of the text labels displayed in the cross-section drawing.
If a sheet format is selected, the number of sheets and the number of profiles per sheet to be represented in the drawing will be displayed below the scale controls.
Representation
Rows and Columns: Both fields are interrelated depending on the number of profiles to be drawn. The initial values are calculated so that the number of rows and columns is approximately balanced. If one value is modified, the other is automatically recalculated so that the product of rows and columns provides the approximate number of profiles to be displayed.
Both fields are enabled only when the Continuous Drawing option is selected, since when a sheet size is specified, these values are calculated automatically.
Display Legend: If this option is enabled, an additional text legend will be placed at the point specified by the user, indicating the meaning of all symbols and legends used in the cross-section drawing.
Drawing Cells
Length and Height: The command automatically calculates these values based on the selected file. They represent the width and height of the cell in which each cross-section is drawn. In addition, minimum and maximum reference values are displayed to guide the user when defining these parameters.
If these margins are considered excessive — since they determine the dimensions of each matrix cell in the drawing grid — both values may be reduced, allowing a greater number of profiles to fit within the selected sheet format.
Representation Style
This option allows the drawing configuration to be saved into a file. As a result, the user can store different profile representation styles and select the desired one whenever needed.

The workflow is as follows: initially, the user configures the desired representation style using all the options provided by the software. Once the configuration has been completed, the "Save" button is pressed to store the settings in a file.
Later, by using the "Select" button, the user can choose any previously created configuration file containing different drawing settings. The corresponding drawing and representation options will then be restored automatically.
This tool is also particularly useful when sharing drawing configurations with another user of the software.
Elements
When this button is pressed, a new dialog box is opened where various profile properties that the program may label in the drawing can be configured. The following window is displayed, and its features are described below.
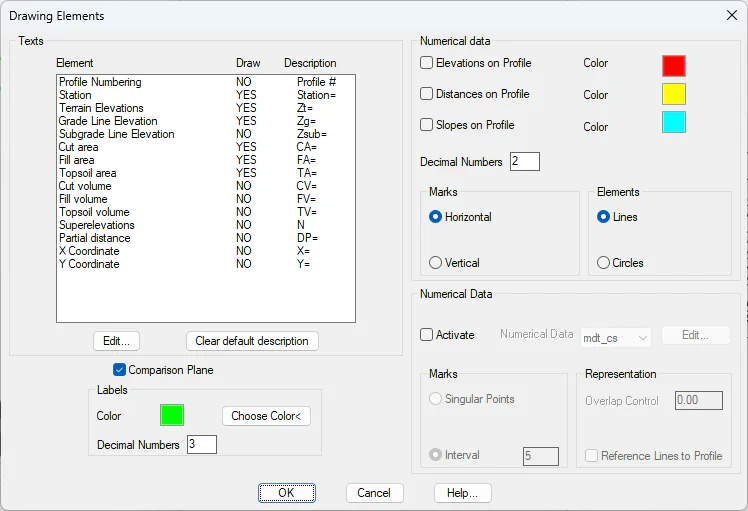
Elements
For each element associated with the cross-section, the user may specify whether it should be displayed and also define the text prefix that will appear in the profile drawing.
Profile Numbering: Displays a sequential numbering system, starting from number one for each profile drawn.
Station (PK): Enabled by default and displays the station value or distance from the origin.
Partial Distances: Indicates the distance relative to the previous section cut.
Ground Elevation: Also enabled by default, as it is very useful for configuring the comparison plane at the intersection between the ground surface and the centerline position. The elevation is displayed with the prefix "Zt=" under the previously defined text. If the Grid Annotation option is enabled, it will appear as one more element within it.
Vertical Alignment Elevation: Enabled only when the profile file to be drawn comes from a segment file, since vertical alignment information is then available. By default, it is displayed with the prefix "Zr=". Likewise, if the Grid Annotation option is enabled, it will appear as an additional element within it.
Subgrade Elevation: This option is available only when a segment is selected. It labels the subgrade elevation at each section cut, provided that the corresponding section has an assigned pavement structure.
Areas: As with the previous option, this feature is enabled only under the same conditions. The associated text is positioned to the right of the centerline, symmetrically to the previously described labels.
The following representations may be selected:
Cut Area
Fill Area
Topsoil Area
The default representation format is "Sd=" for cut area, "St=" for fill area, and "Sv=" for topsoil area.
Volumes: Displays the calculated volume between the current station and the immediately preceding one.
The following representations may be selected:
Cut Volume
Fill Volume
Topsoil Volume
The default representation format is "Vd=" for cut volume, "Vt=" for fill volume, and "Vv=" for topsoil volume.
Superelevations: Labels the superelevation to be applied on both the left and right sides of the segment station to be drawn.
Coordinates: Option available only when a segment is selected. The X and Y coordinates of the station at the centerline position will be labeled.
Edit: Allows editing of any element in order to modify either the prefix text or whether it will appear in the drawing.
Initialize Description: Restores the default prefix values for the different elements.
Color: Selection of the color used for the text labels associated with the Elements option.
Draw Comparison Plane: Draws the comparison plane associated with each section cut.
Elements to Label
Profile Elevations: Displays elevations above the ground line at each point defining the cross-section profile. The text color may be customized.
Profile Distances: Displays distances from the centerline below the ground line at each point defining the cross-section profile. The text color may be customized.
Profile Slopes: Displays the slopes of each vector segment. The value is shown above each polyline segment and labeled as a percentage. The text color may also be customized.
Distance and Elevation Text Orientation: The distance and elevation labels displayed on the profile may be oriented either horizontally or vertically.
Profile Markers: The markers displayed on the profile may be represented either as a line or as a textured circular symbol.
Numerical Data
Enable: This section allows the activation and configuration of the grid annotation ("guitar") associated with cross-sections.
By default, two predefined grid annotation styles are already available, associated with profile drawing:
simple_cs: Grid configuration for terrain cross-section drawings.
mdt_cs: Grid configuration for segment drawings, i.e., cross-sections combined with the typical cross-section design.
Edit: This button provides access to the grid configuration settings, including the elements to be displayed and the text configuration. For further details, refer to the Grid Definition section.
Markers: Defines the interval for displaying labels associated with grid elements.
Critical Points: Labels the vertices of the cross-section cut.
Interval: Defines the text display interval.
Profile Reference Lines: This option is only available when the grid annotation is enabled. If activated, the markers on the profile are extended up to the comparison plane.
Overlap Control: Option used to prevent text overlap. It defines the minimum distance allowed between two consecutive labels.
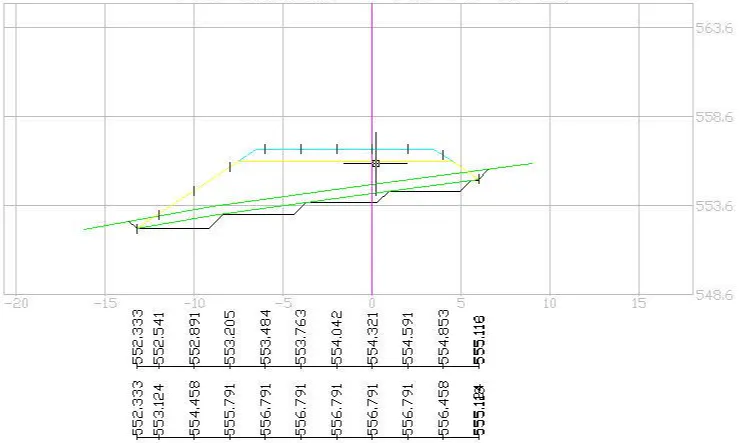
The following image shows an example of a profile representation with the associated grid annotation.
Texts
In this section, the position of the texts associated with the profile to be drawn can be customized.
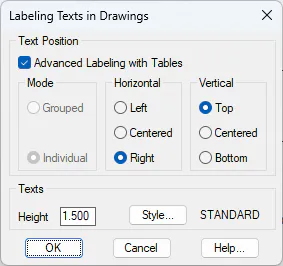
Advanced labeling with tables: If this option is enabled, the properties or texts associated with each section cut are displayed in a table format.
If the option is not enabled, the texts are displayed as independent entities.
Additionally, the position of the texts can be customized both horizontally and vertically, placing them in the lower, upper, or intermediate area.
Text Position: This option allows the user to define where the texts associated with each cross-section will be displayed. They can be drawn either horizontally in the upper-left area of each profile or vertically along the left side of each section.
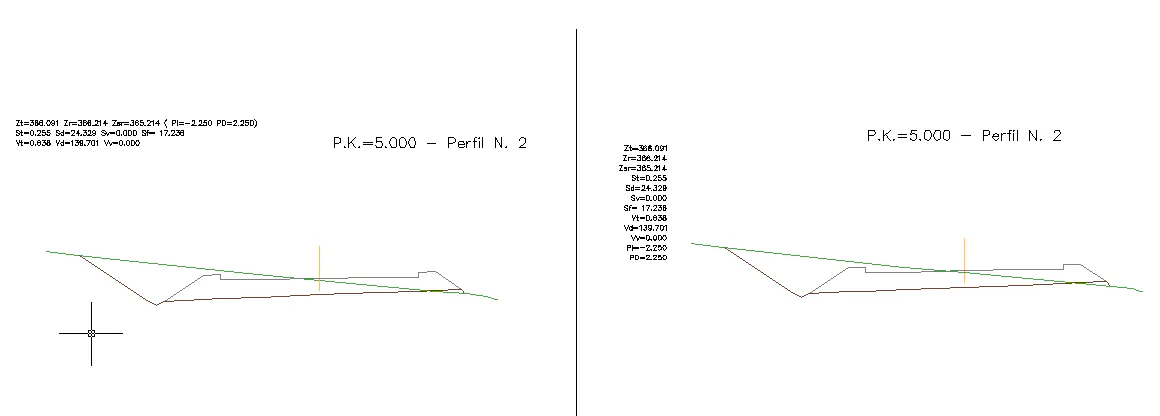
Text Style: This option allows the user to select the text style to be applied to the labels displayed in the cross-section drawing. By pressing the "Styles…" button, any of the text styles previously defined in the CAD environment can be selected.
Advanced
From this option, additional profile drawing settings can be configured.
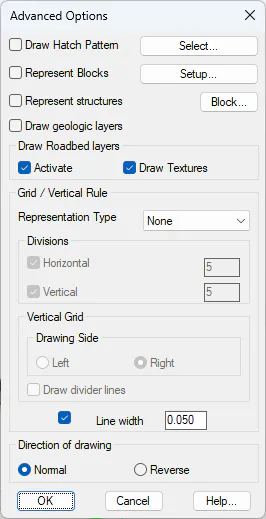
Draw hatches: This option is only available for segment drawings. When enabled, it displays a hatch pattern in the area corresponding to the volume to be computed.
The hatch type can be selected by pressing the Select button.
Insert blocks: This option allows the user to select blocks to be drawn together with the cross-sections.
By pressing the Configure button, a dialog box is displayed where the insertion point for each block can be defined for the different cross-section cuts.
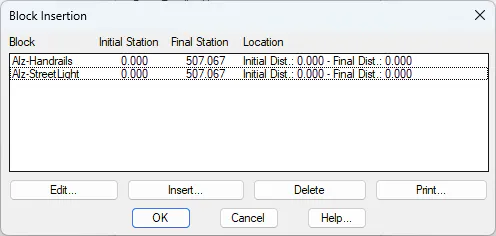
To insert or modify blocks for cross-section drawing, the following dialog box is displayed.
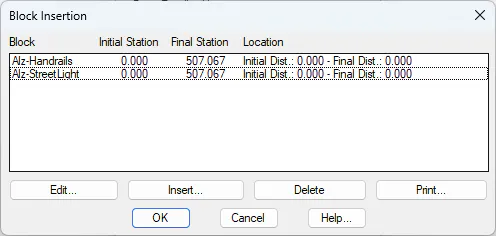
Everything related to block definition and management is described in more detail in the command:Alignments > Block Definition.
Display Structures: If this option is enabled, and structures exist in the segment definition, the selected block will be displayed at those stations where a structure is defined.
Draw Pavement Layers: This option is only available for segment drawings. When enabled, the program will draw the pavement layers associated with the section definition, provided that such layers have been previously defined.
Draw Geological Layers: Available only when a segment is selected. If geological layers are assigned to the segment, enabling this option will display the different soil strata.
Drawing Direction
This option allows the user to define how cross-sections will be arranged:
Normal: Draws first by columns and then by rows. The initial station corresponds to the upper-left corner section (top-to-bottom drawing direction).
Reversed: Also draws first by columns and then by rows, but in this case the initial station corresponds to the lower-left corner section (bottom-to-top drawing direction).
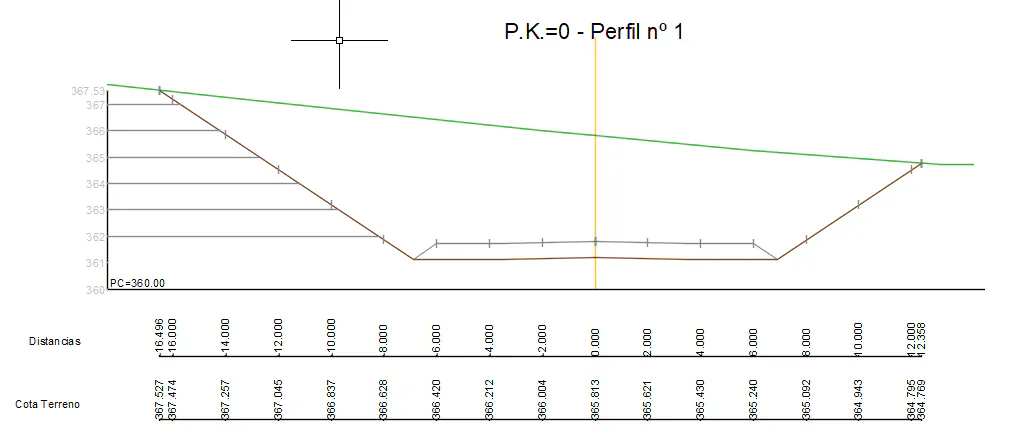
Grid: This option allows a vertical grid or scale to be drawn for each section. The spacing between major and minor ticks can be customized.
If Vertical Scale is selected, it can be placed either on the left or right side of the profile. Additionally, horizontal lines can be drawn connecting the scale annotations to the ground profile by enabling the Draw division lines option.
Line width: Specifies the line weight used for drawing cross-section lines.