tcpMDT
Label Plots - MDT26
Label Plots
 | Command to execute in the CAD |
|---|---|
Vertical menu | MDT26 > Plots > Label |
Ribbon menu | Plots > Utilities > Label Plots |
Command line |
This command inserts a table in the drawing with detailed information on a selected plot. The program will first ask for the designation of the plot and then the following dialogue box will appear:
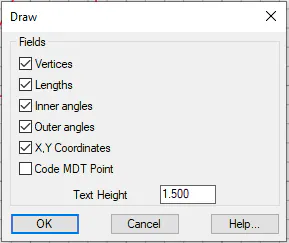
The possible fields to be drawn are:
Vertices. The number of the topographic point if it coincides with the vertex, or the sequential number of the polyline vertex in accordance with the order of drawing.
Lengths. The length of each side of the plot.
Inner angles. The angle that each vertex forms with regard to the adjacent sides, measured inside the plot.
Outer angles. The angle that each vertex forms with regard to the adjacent sides, measured outside the plot.
X, Y coordinates. The coordinates of the vertices of the plot.
Code MDT Point. The code of the topographic point, if it coincides with a vertex of the polyline defining the plot.
Furthermore, we can specify the Text Height for all the texts in the table to be drawn.
Next, an insertion point will be requested for the table to be created. This point corresponds to the upper left corner of that table.
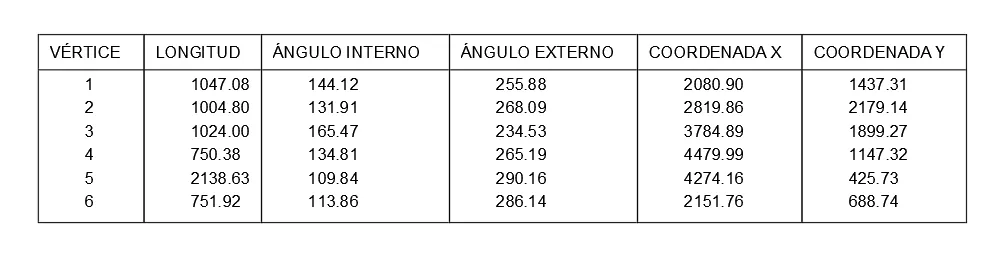
The command is repeated until the plot selection command is cancelled. It illustrates the following items for each of the plots:
Dimension Plots
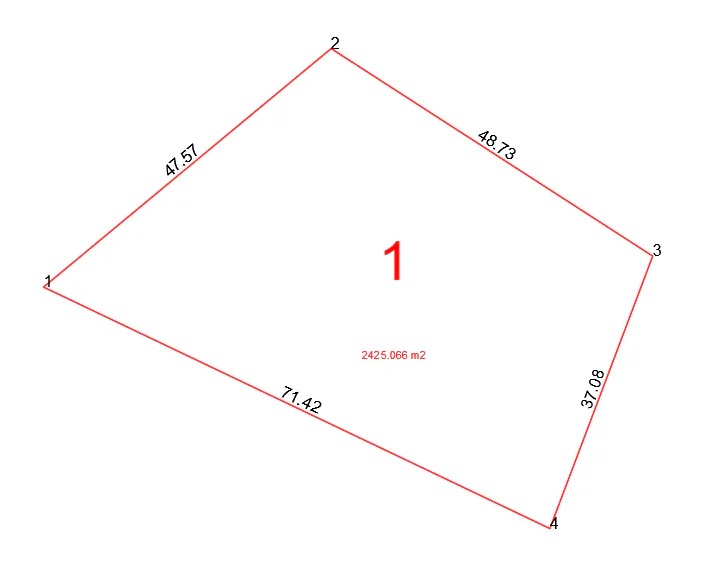
This command limits the selected plots, drawing informative texts on the same. The following dialogue box will appear after the program asks for these plots:
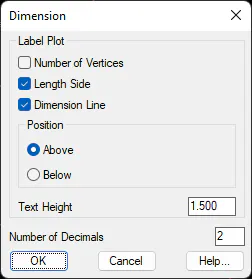
Number of Vertices. Its number relative to the polyline is labeled near the vertex, starting at 1.
Length Side. The length of each side is labeled with the position and height of the text specified in the following controls.
Dimension Line. If this option is enabled, a line is drawn on the dimension layer on each side of the plot.
Position. Indicates if the lengths of the sides are to be labeled Above or Below the line that defining these sides.
Text Height. Specifies the height of the texts to be drawn by this command, for both vertex numbers and side lengths, in drawing units.
Number of Decimals. Specifies the number of decimal places to be used to label the side lengths.
The selected plots will be dimensioned once the parameters have been placed in the dialogue box.